Feature Selection
Mutual Info Regression is used to detect feature importance:
from sklearn.feature_selection import mutual_info_regression
from matplotlib import pyplot as plt
import seaborn as sns

def make_mi_scores(x, y):
    x = x.copy()
    discrete = x.dtypes == int
    return pd.Series(mutual_info_regression(x, y, discrete_features=discrete, random_state=42), index=x.columns).sort_values(ascending=False)

def plot_scores(scores, n, high=True):
    plt.figure(figsize=(5, 5))
    plt.title('Mutual Information')
    if high:
        sns.barplot(x=scores[:n], y=scores.index[:n])
    else:
        sns.barplot(x=scores[(-1 * n):], y=scores.index[(-1 * n):])
    plt.ylabel('Features')
    plt.xlabel('Score')
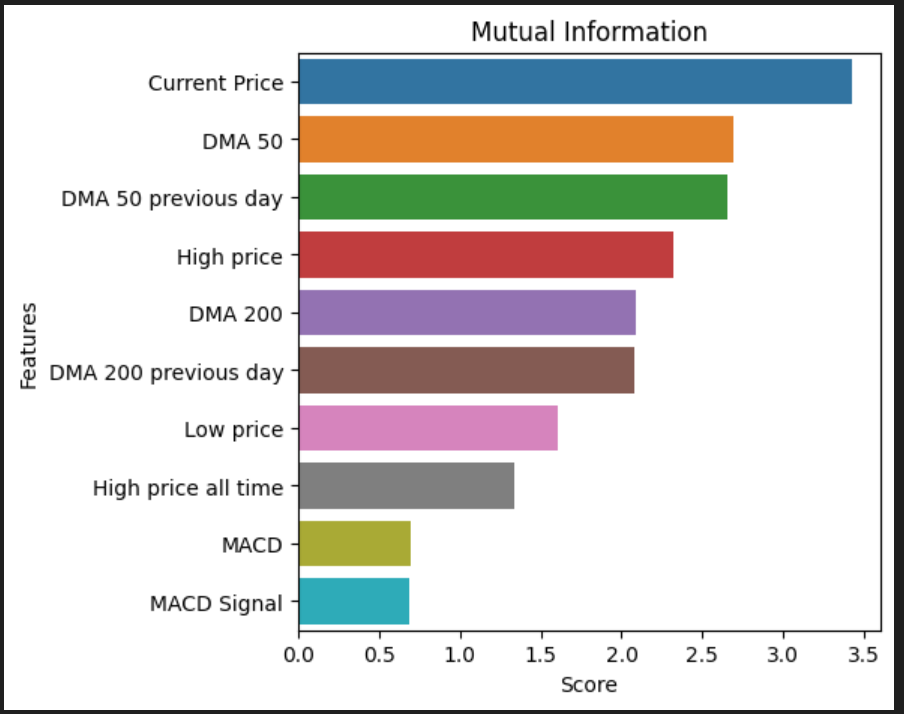
The most important features are:
scores = make_mi_scores(x, y)
plot_scores(scores, 10)
A function is made to score a model on a dataset using cross validation:
from sklearn.model_selection import cross_val_score

def score_dataset(x, y, model):
    x = x.copy()
    return cross_val_score(model, x, y).mean()
Features having importance lower than a certain threshold are removed and the dataset is scored using various models. Ridge regressor turns out to be the best model:
from sklearn.linear_model import Ridge

threshold = 0.25

features = scores[scores < threshold].index
x_temp = x.drop(features, axis=1)
score_dataset(x_temp, y, Ridge(random_state=42))

# score = 0.9767751947866273
Optuna is used to tune the threshold optimally to maximize the cross-validation score:
import optuna

def objective(trial):
    threshold = trial.suggest_float("threshold", 0, 0.9)

    features = scores[scores < threshold].index
    x_temp = x.drop(features, axis=1)

    return round(score_dataset(x_temp, y, Ridge(random_state=42)), 6)

study = optuna.create_study(direction="maximize")
study.enqueue_trial({"threshold": 0.25})
study.optimize(objective, n_trials=100)
study.best_trial

# threshold = 0.6775112677500316
Thus, it is found that the only features that should be retained are 50 DMA, 200 DMA, MACD, MACD signal and Price features (Current Price, High Price, Low Price).
50 DMA and 200 DMA (DMA stands for Days of Moving Average) are moving averages. They indicate the trend of the stock price.
MACD (Moving Average Convergence Divergence) and MACD signal are technical indicators that quantify the current momentum of the stock. MACD is the difference between the short-term and long-term exponentially weighted moving average, giving more importance to recent values.
The MACD line is calculated by subtracting the 26-period EMA from the 12-period EMA. The calculation creates the MACD line. A nine-day EMA of the MACD line is called the signal line, plotted on top of the MACD line, which can function as a trigger for buy or sell signals.
threshold = 0.6775112677500316

features = scores[scores < threshold].index
x_new = x.drop(features, axis=1)
score_dataset(x_new, y, Ridge(random_state=42))

# score = 0.9940835777001986